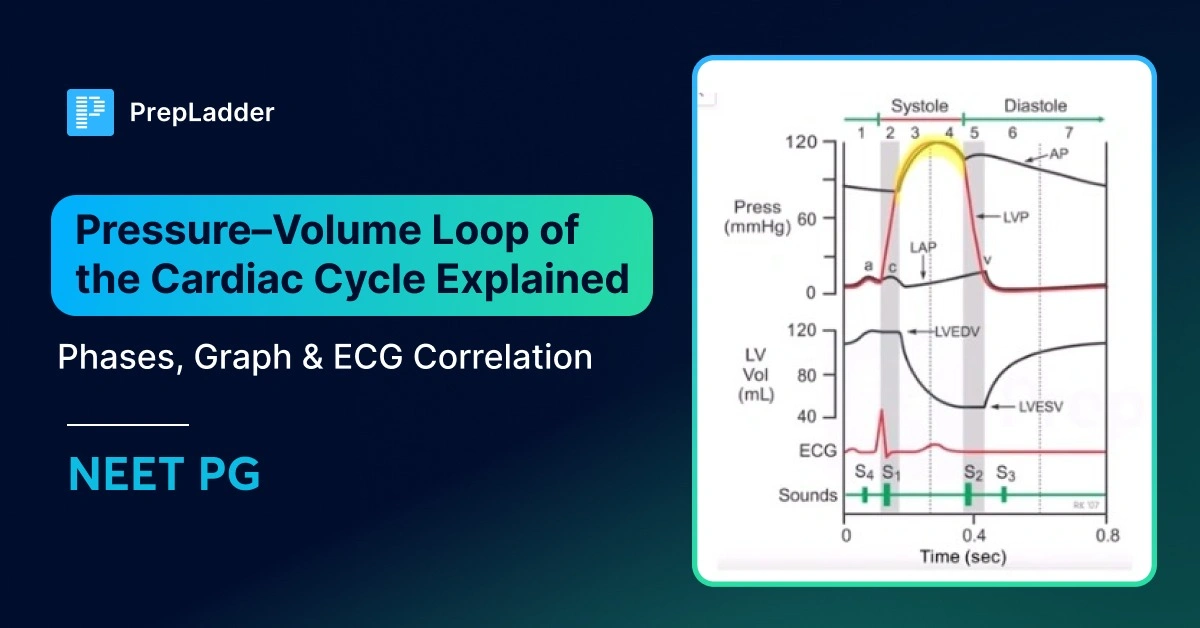
Pressure–Volume Loop of the Cardiac Cycle Explained: Phases, Graph & ECG Correlation
Nov 21, 2025

What is the Cardiac Cycle
The cardiac cycle refers to cyclical events at the ventricles’ level. It is already known that the atria form a separate syncytium tissue, and the ventricles form a separate syncytium tissue. Therefore, whatever happens in the left ventricle is also happening in the right ventricle. Both ventricles cause contraction simultaneously.
The left ventricle contraction starts a bit earlier than the right ventricle. Since depolarization occurs first in the left ventricle, contraction also begins there. However, in the case of blood ejection, it will start earlier in the right ventricle than in the left ventricle. This is because the right ventricle ejects blood via the pulmonary artery, where pressure is a little lower than the arch of the aorta.
Duration of The Cardiac Cycle
The total duration of the cardiac cycle is 0.8 seconds. This duration is obtained when we divide 60 seconds by the heart rate in one minute.
Duration of the Ventricular Cycle
The total duration of 0.8 seconds is divided into systolic and diastolic durations. Systole is 0.3 seconds, and diastole is 0.5 seconds. This duration is for the ventricular systole and diastole, respectively.
Duration of the Atrial Cycle
The atrium systole is for a shorter duration, that is, 0.1 seconds. The atrium diastole is for 0.7 seconds. Total duration is 0.8 seconds.
If a person is exercising, what will be their cardiac cycle duration?
When exercising, the heart rate of the person will increase immediately. This increase in heart rate can occur even before one has started exercising. The heart rate is in the denominator when calculating the duration of the cardiac cycle. Thus, an increased heart rate means that the total duration of the cardiac cycle will decrease.
However, the question here arises: when the total cardiac cycle duration decreases, which duration will decrease, the systole or the diastole, or both? The answer is that both the systole and diastole durations will decrease. However, the diastole duration will decrease much more than the decrease in systole duration. The diastole is a passive process. The decrease in the diastole duration will be easier than the active process, which is systole.
|
|
Phases of The Cardiac Cycle
In a cardiac cycle, some phases occur during diastole and some during systole. These phases take place at the ventricular level. The following acronyms are used to mention the phases:
Phases in the cardiac cycle
Diastole:
- Protodiastole
- Isovolumic relaxation (IVR)
- First rapid filling phase (FRFP)
- Diastasis
- Last rapid filling phase
Systole:
- Isovolumic contraction (IVC)
- Rapid ejection (RE)
- Slow ejection (SE)
Diastole
- Protodiastole – 0.04
- Isovolumic relaxation (IVR) – 0.06
- First rapid filling phase (FRFP) – 0.1 0.5
- Diastasis – 0.2
- Last rapid filling phase (LRFP) – 0.1
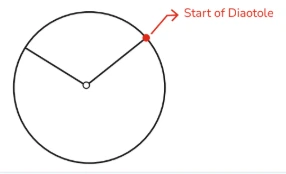
In order to completely understand the various phases, a circle is drawn, and the various phases are then plotted inside the circle. The circle is divided into two halves.
The smaller half is systole, and the bigger half is diastole. The total duration of this ventricular cycle is 0.8 seconds. Out of this, the systolic duration is 0.3 seconds, and the diastolic duration is 0.5 seconds.
Here, we start with the duration of the diastole. Here, the right ventricle is the centre of discussion, but only for ease of understanding. However, what is happening at the level of the right ventricle is also happening at the level of the left ventricle.
First, we will look into what is happening at the beginning of diastole, which is the end of systole.
Isovolumic Relaxation Phase (IVR)
When the semilunar valve is closed, the ventricle relaxes more and more. This relaxation continues with the closure of the semilunar valve, and the tricuspid valve is already closed. So, all the valves in the heart are closed. That’s why the remaining blood volume will not change and remains constant despite the ventricle's relaxation. This state of relaxation is known as isovolumic relaxation.
Just after the closure of the semilunar valve, the next phase is known as the isovolumic relaxation phase (IVR). The duration of the phase is 0.06 seconds. The continued relaxation of the ventricle marks a distinct characteristic of this phase, while the blood volume remains constant. The net result of this phase is that the chamber pressure falls more and more. The ventricular pressure will be the lowest at the end of the isovolumic relaxation phase, nearly equal to 0 mmHg.
Also Read: Heart Disease: Causes and Symptoms
First Rapid Filling Phase (FRFP)
When the relaxation occurs, the right atrium gets blood from the superior vena cava and the inferior vena cava. Now the atrium is full of blood, and its pressure is 7-8 mmHg. So, ventricular pressure is 0 mm Hg, and the right atrium pressure is 8 mmHg. This pressure disparity leads to the tricuspid or atrioventricular valve opening. Due to the huge pressure difference, the blood starts rushing into the ventricular cavity with high velocity.
This will lead to the ventricular blood volume expanding and the ventricular pressure rising to 2 mmHg. There is a gradual filling of the ventricular cavity. This phase is known as the first rapid filling phase (FRFP). This phase lasts for 0.1 seconds. Now the atrium pressure falls because blood has flown out, causing an increase in ventricular pressure instead.
Slow Filling Phase or Diastasis
The pressure difference between the atrium and ventricular chamber has decreased. The valve is still open. Thus, blood will continue to enter but will have less velocity. Thus, there is a change from the rapid to the slow filling phase. This is known as the diastasis or slow-filling phase of the cardiac cycle.
This phase has a duration of 0.2 seconds. This phase is very important because, during this phase, the tricuspid valve opens, both the atrium and ventricle are relaxed, and blood is slowly moving toward the ventricular cavity.
Because of this, the ventricular wall motion is minimal. At the end of the slow-filling phase, the blood has filled into the ventricular chamber, and the pressure in the atrium and the ventricular chamber is almost the same.
Atrium Systole
Now, for the blood to flow into the ventricular chamber, the atrium has to contract. This contraction causes a push and causes rapid entry of the remaining blood from the atrium into the ventricular chamber. This contraction is known as atrium systole, with a duration of 0.1 seconds.
Last Rapid Filling Phase (LRFP)
Once the contraction begins, blood is pushed into the ventricle again. The rapid blood flow and filling of the ventricle start once again. This rapid filling phase is known as the last rapid filling phase of the ventricle. The duration of this phase is 0.1 seconds. This is the only phase where the atrium is contracting. LRFP coincides with the atrium systole or atrium contraction.
The ventricle filling does not occur in the isovolumic relaxation phase because all the valves are closed. The filling only occurs during the first rapid filling phase, diastasis, and the last rapid filling phase. During diastasis or slow-filling phases, the ventricular wall motion is minimal. It is almost at a standstill.
The LRFP is the only phase where the atrium is contracting. The LRFP or atrium contraction is responsible for 25-30% of ventricular filling. Since 25% of filling is completed by active contraction of the atrium, it is known as “active filling” of the ventricle.
A combination of the first rapid filling and the diastasis phases is responsible for the rest of the 70-75% filling. This is known as the “passive filling” of the ventricle, as contraction plays no part in this type of filling.
Protodiastole
Some books omit protodiastole and do not consider it part of the cardiac cycle, while others consider it part of systole. That’s why it’s explained at the end. The start of diastole or the end of systole is when the ventricular chamber is fully contracted, and most of the blood is ejected.
Whenever the ventricle starts its relaxation, there is muscle relaxation (removal of Ca2+ from the cytoplasm to the sarcoplasm) followed by ventricular cavity enlargement. Then there is going to be a closure of the semilunar valve. The relaxation of muscle here happens at the molecular level. There is a time gap between muscle relaxation and cavity enlargement. This gap is known as protodiastole.
Protodiastole, as it is understood, is muscle relaxation. The chamber dilation has not yet started at this point. It is sometimes considered a part of the systole because blood still flows toward the pulmonary artery. The protodiastole phase has a very short duration of 0.04 seconds. The beginning of the protodiastole phase is the beginning of muscle relaxation, followed by the closure of the semilunar valve.
This brings us to the end of the diastole phases with these respective durations for each.
At the end of the diastole, the total blood volume in a single ventricular chamber is known as the End Diastolic Volume (EDV). However, whenever an EDV is mentioned, it is mentioned for a single ventricle, which is 130 ml. Whenever there is an end-diastolic volume, there will be an end-diastolic pressure (EDP).
The EDV is the same for both the right and left ventricles. EDP is 1-7 mmHg for the right ventricle and 4-12 mmHg for the left ventricle.
Systole
- Isovolumic contraction (IVC) → 0.05
- Rapid ejection (RE) → 0.1
- Slow ejection (SE) → 0.
When the ventricle is filled with EDV, the systole will start. Thus, there’ll be the start of contraction. At the beginning of the contraction, the tricuspid valve is still open. The semilunar valve has already been closed at the beginning of the diastole.
The pressure within the ventricular chamber will increase. When the pressure increases, the blood will show a tendency to go back into the atrium. The immediate closure of the tricuspid valve prevents this.
Thus, the immediate onset of systole is the closure of the atrioventricular or tricuspid valves. Filling of the ventricle with EDV will cause the onset of systole and, thus, immediate closure of ventricular valves. This is the point where the first heart sound gets created.
Rapid Ejection Phase and Slow Ejection Phase
Now that the semilunar valve is open and the tricuspid valve is closed, blood will be ejected into the pulmonary artery. This ejection happens quickly and is known as the rapid ejection (RE) phase.
After some time, the ejection becomes slower, known as the slow ejection phase (SE). The slow ejection phase has a longer duration, 0.15 seconds. The rapid ejection phase has a duration of 0.1 seconds.
Changes in Pressure During the Cardiac Cycle
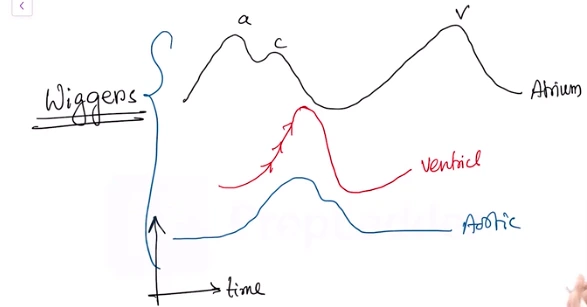
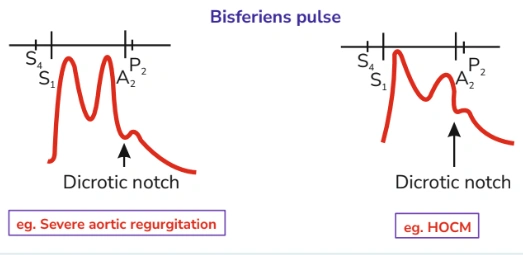
The above diagram shows pressure changes in the atrium, ventricles, and the aortic pressure changes via a graph with the X-axis denoting time and the Y-axis denoting pressure. On a closer look at the atrium pressure change, we can observe a pressure-changing curve via the jugular venous pulse. In the ventricular pressure curve, which is drawn in red, we see a rise followed by a fall.
The aortic pressure change is denoted by a curve drawn in blue in the diagram. All these curves are plotted into one diagram, which is known as a Wiggers diagram.
X-axis= Time
Y-axis= Pressure
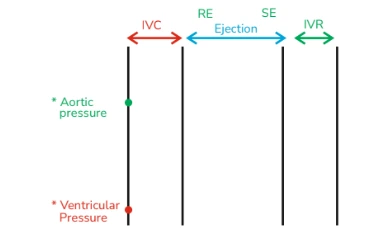
The gaps between the lines are time gaps between different events in a cardiac cycle. As per the graph, the gap between the first two timelines is the phase of isovolumic contraction. The time gap between the next two lines is the ejection phase of the cardiac cycle, which consists of the rapid and slow ejection phases.
The time gap between the last two lines is isovolumic relaxation. The red point denotes the ventricular pressure. The green point is the aortic pressure.
The first phase here is the beginning of isovolumic contraction. It is the end of diastole and the beginning of systole. So, the end-diastolic pressure here is 4-12 mm Hg. The pressure at the arch of the aorta at the beginning of systole is 80 mmHg.
.jpg)
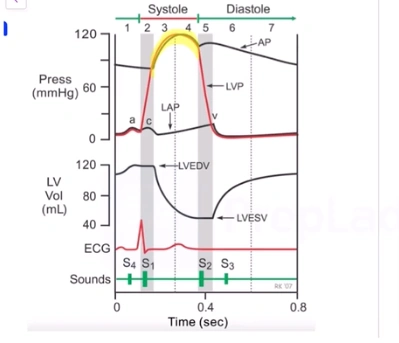
Ventricular Pressure Curve
On contraction, the ventricular pressure rapidly rises. The aortic pressure remains the same, and at a certain point, the ventricular pressure rises above the aortic pressure, thus opening up the aortic valve.
Blood is then ejected to the arch of the aorta while ventricular pressure continues to rise as it’s still contracting. The aortic pressure also increases proportionally, while still lower than the ventricular pressure.
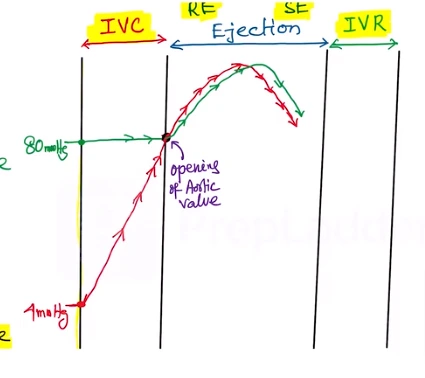
When the ejection continues, the ventricular pressure will start falling, and the aortic pressure will also start falling proportionately. However, now the aortic pressure is more than the ventricular pressure, but the ejection continues.
This is due to the momentum of the flowing blood. Ultimately, it reaches a point where momentum slows down. Now, the ventricular pressure is lower than the aortic pressure. This is when the blood will try to fall back from the arch of the aorta. The immediate closure of the aortic valve prevents this.
Now the isovolumic relaxation starts, the ventricle relaxes more and more, and pressure thus falls to near 0 mmHg. This is the point where the filling of the ventricle will start again.
The mitral and tricuspid valves open, the ventricular filling starts again, and the pressure will then again rise. Here, passive ventricular filling is followed by active filling.
Aortic Pressure Curve
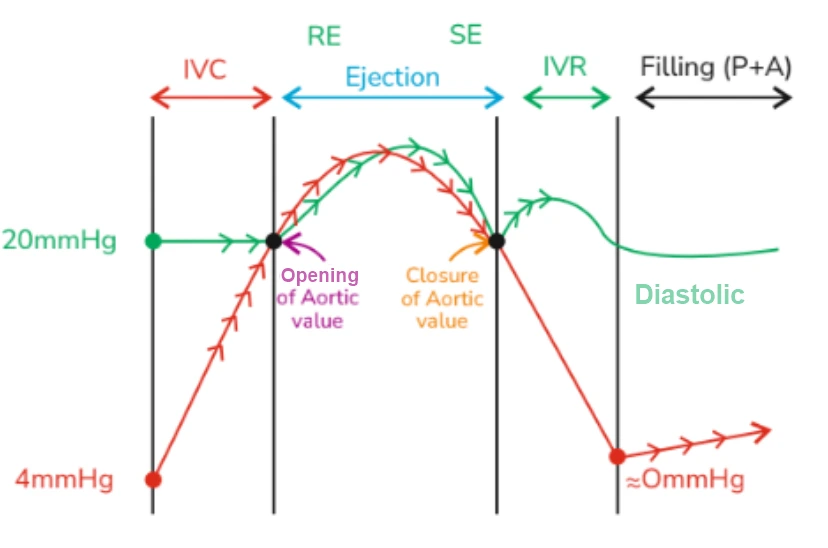
During the closure of the aortic valve, the aortic pressure rises again, falls a while later, and then remains constant, which is the diastolic pressure marked at the filling phase. Here, the aortic pressure changes can be observed through the curve plotted in green.
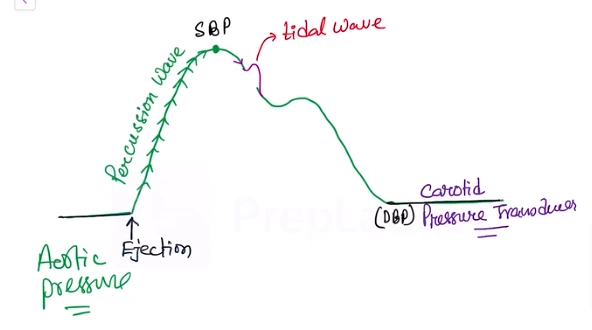
The aortic pressure curve is typically recorded in the carotid artery by placing a carotid pressure transducer. On recording the pressure from the carotid, we see that the pressure increases, reaching a peak point, which is the systolic blood pressure point.
This is the maximum pressure at the aorta level during the ejection of blood. The point here the pressure stabilizes is the diastolic blood pressure.
The ejection of blood starts, and when the pressure rapidly rises, it forms a percussion wave, as shown in the above curve. When the pressure falls, sometimes, there can be a little rise, known as a tidal wave. This is because when blood is ejected into the arch of the aorta.
Due to the presence of a huge amount of elastic tissue, there will be an expansion of the arch of the aorta. The blood will also be reflected back from the aortic wall, causing the aortic pressure to rise a little. This reflective wave is called the tidal wave.
The aortic pressure continues to fall, and the semilunar valve is closed as a result. This will give rise to the notch called the dicrotic notch. It is the closing point of the aortic valve. After the closure of the valve, the arch of the aorta will return to its former position. This is elastic recoiling.
There is then an increase in aortic pressure, which can be seen through the dicrotic wave formed due to the elastic recoiling of the aorta. After this, the pressure usually falls to the diastolic blood pressure line. Sometimes, the percussion wave side of the curve is known as the anacrotic limb, and the other side is known as the dicrotic limb.
Carotid Pressure Curve
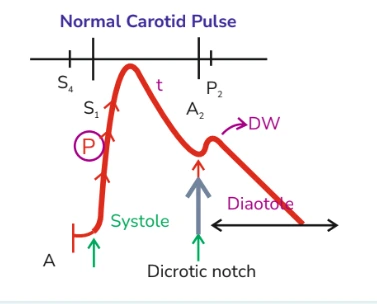
By recording the pressure pulse from the arch of the aorta or carotid artery, certain abnormalities are detected. In the above diagram, the percussion wave, marked as P from the onset till the dicrotic notch, is the systole phase. The remaining part is the diastole phase. T is the tidal wave.
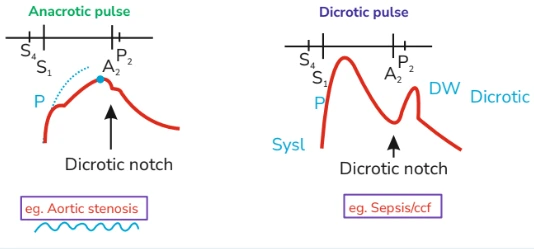
When the blood ejection is improper, there will be a slower formation of the percussion wave, P wave. This is known as the Anacrotic pulse and denotes the case of Aortic stenosis. When there are two distinct peaks, one for the systole and one for the diastole, this is known as the Dicrotic pulse. This is typically seen in low cardiac output conditions.
When there are two peaks, and both occur during systole, it is known as a Bisferiens pulse. Here, both the percussion and the tidal waves are prominent.
This means that the reflective wave from the arch of the aorta becomes very prominent. Such pulse is seen in the case of severe Aortic regurgitation or even for HOCM patients.
In a Wiggers Diagram, we see that aortic and ventricular pressure change proportionately during this systolic ejection phase. Atrium and ventricular pressure change proportionally during the filling phase in the diastole. There is a little gap between the aortic pressure and the ventricular pressure.
Suppose a catheter is introduced into the left ventricle. The atrium and aortic pressure are being measured. By plotting a Wiggers diagram, the diagnosis of valvular diseases is possible.
Valvular Stenosis
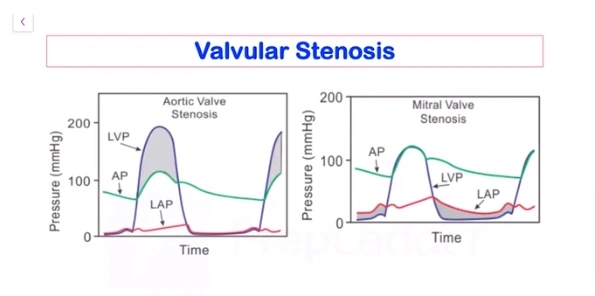
By plotting a Wiggers diagram, the diagnosis of this disease is possible. For example, in aortic stenosis, the opening of the aortic valve is reduced. When the isovolumic contraction is going on, the aortic valve cannot open up despite the pressure.
Thus, the ventricular pressure has to be much higher than usual to open up the valve. The volume of blood ejected will still not be enough due to the restricted opening.
Thus, ventricular pressure will rise substantially while the aortic pressure still remains low. As can be duly noted in the diagram. The gap between the LVP (left ventricular pressure) and AP (aortic pressure) is a distinct feature of Aortic valvular stenosis.
In the case of mitral valve stenosis, the problem arises between the left atrium and left ventricle. The blood from the left atrium will not be able to enter the left ventricle, leading to improper filling. This takes place in the diastolic phase of the cardiac cycle.
During diastole, the pressure in the left atrium and ventricle changes proportionally. However, during stenosis, the left atrium pressure rises to a very high level, and due to the blood being restricted due to the stenosis, there is low pressure in the ventricle (EDP).
Thus, the big gap between the two pressure curves is important to know if there is Mitral valve stenosis.
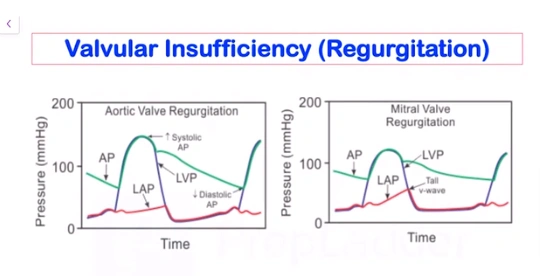
Aortic valve regurgitation means that the valve is not able to close completely during the diastole of the ventricle. This makes some blood fall back from the aorta and left atrium to the ventricle. Thus, with blood flowing in from both the aorta and atrium, the EDV will increase. This will, in turn, increase the stroke volume, increasing the systolic blood pressure.
The diastolic blood pressure will be very low because blood is falling back into the ventricle. This huge gap between systolic and diastolic blood pressure is called Aortic valve regurgitation. In mitral valve regurgitation, the blood is regurgitated back to the left atrium. It happens during the systole period.
The mitral valve does not close properly. Although the blood should flow only in one direction, that is, in the arch of the aorta, some of it goes back into the atrium.
The atrium gets more blood due to regurgitation, and atrium pressure rises. The atrium normally gets blood from the pulmonary vein. This is known as the venous return phase. The v-wave is thus very prominent.
Thus, the left atrium is getting a lot of blood from both sources: the ventricle and the pulmonary vein. The right atrium pressure will be very high during its filling. Due to venous return, high atrial pressure of around 25 to 30 mmHg is the feature of mitral valve regurgitation, as seen from the tall v-wave.
Download the PrepLadder app now and unlock a 24-hour FREE trial of premium high-yield content. Access Video Lectures also in हिंglish, digital notes, QBank, and Mock Tests for FREE to ace your NEET PG preparation. Elevate your study experience and gear up for success. Start your journey with PrepLadder today!

PrepLadder
Access all the necessary resources you need to succeed in your competitive exam preparation. Stay informed with the latest news and updates on the upcoming exam, enhance your exam preparation, and transform your dreams into a reality!
Navigate Quickly
What is the Cardiac Cycle
Duration of The Cardiac Cycle
Duration of the Ventricular Cycle
Duration of the Atrial Cycle
If a person is exercising, what will be their cardiac cycle duration?
Phases of The Cardiac Cycle
Diastole
Isovolumic Relaxation Phase (IVR)
First Rapid Filling Phase (FRFP)
Slow Filling Phase or Diastasis
Atrium Systole
Last Rapid Filling Phase (LRFP)
Protodiastole
Systole
Rapid Ejection Phase and Slow Ejection Phase
Changes in Pressure During the Cardiac Cycle
Ventricular Pressure Curve
Aortic Pressure Curve
Carotid Pressure Curve
Top searching words
The most popular search terms used by aspirants
- NEET PG Physiology
- NEET PG Physiology Preparation
- NEET PG Preparation Strategy