Biostatistics Multiple-Choice Questions for Health Sciences - PrepLadder
Nov 17, 2025

A series of multiple-choice questions focused on the field of biostatistics. Each question will assess knowledge and understanding of key biostatistical concepts and methods, aiming to enhance comprehension and application of statistical analysis in the biological and health sciences.

Let's start with the question and answer series:
MCQ's
Q. Blood pressure is which type of variable?
- Nominal
- Qualitative
- Discrete
- Continuous
Q. Which of the following is a continuous variable?
- Blood group
- Weight
- Religion
- Sex
Explanation:
Pulse rate:
It's a quantitative, continuous and polytomous variable
- Can be measured in units (beats/min) and can be compared.
- Expressed in decimals.
- Can take up many values.
- E.g., Count the pulse rate for 2 min and it comes out 165 beats in 2 min, so in 1 min it will be 165/2, i.e., 82.5 beats.
Presence / absence of hypertension
- Qualitative: It cannot be measured in units; either a person is hypertensive or not.
- Discrete
- Dichotomous
Also read: Neural Regulation of Respiration: Control & Mechanisms
Q. In a study, the following interpretations are obtained: Satisfied, very satisfied, dissatisfied. Which type of scale is this?
- Nominal
- Ordinal
- Interval
- Ratio
Q. An investigator studies into the life expectancy of IV drug abusers and divides a sample of patients into HIV positive and HIV negative groups. What type of data does this division constitute?
- Nominal
- Ordinal
- Interval
- Ratio
Q. A study wishes to assess birth characteristics in a population. Which of the following describes the appropriate measurement scale or type?
- Continuous
- Ordinal
- Nominal
- Dichotomous
A. --------- Birthweight in grams
B. --------- Birthweight classified as low, medium, or high
C. --------- Birthweight classified as low, not low
D. --------- Delivery type classified as cesarean, natural, induced
Ans.
- Birthweight in grams: Continuous
- Birthweight classified as low, medium, high: ordinary
- Birthweight classified as low, not low: Dichotomous
- Delivery type classified as cesarean, natural, or induced: Nominal
Also read: Organic Plant Irritant Poisons: Symptoms, Treatment & Effects
Q. Which scale of measurement best represents central tendency?
- Mean: Dimensional or metric scale.
- Median: Ordinal scale
- Mode: Nominal scale
- All of the above
Q. 18, 20, 22, 24, 26, 28 and 30. Best Central Tendency is determined by
- Mean
- Median
- Mode
- Range
Explanation:
- All observations are of two digits.
- No outliers are present.
- In this data set there is no outlier, so this data set is not skewed, i.e., this is normal data distribution.
- So "mean" is the best central tendency.
Q. The number of malaria cases reported during the last 10 years in a town is given below: 250, 320, 190, 300, 5000, 100, 260, 350, 320, and 160. The epidemiologist wants to find out the average number of malaria cases reported in that town during the last 10 years. The most appropriate measure of average for this data will be
- Arithmetic mean
- Mode
- C.Median
- Geometric mean
Explanation:
- Data has outliers, making it skewed.
- The outlier here is 5000, which may have been mistaken for 500.
- If the mean is calculated using 5000 values, we get an exaggerated value.
- If the median is calculated, arrange in ascending order, i.e., 100, 160, 190, 250, 260, 300, 320, 320, 350, 5000 (even observation)
- Median = average of two middle values = 260 + 300 / 2 = 280.
- The outlier 5000 doesn't interfere with the result.
Also read: Overview of Key Child Health Initiative Programs in India
Q. Bimodal distribution is represented by
- Mode = 3 median + 2 mean
- Mode = 3 median - 2 mean
- Mode = 2 median + 2 mean
- Mode = 2 median - 2 mean
Q. Most common deviation used in social medicine is
- Mean
- Range
- Variance
- Standard deviation
Q. Is it possible to measure variation between two different units of the data set?
- Variance
- Coefficient of variation
- Standard deviation
- Range
Ans. Coefficient of variation = σ/mean x 100
Q. "True statements regarding standard deviation is/are:
- 1 SD covers 95% value in a distribution
- It indicates the distribution of variables
- It is most commonly used method of dispersion
- Applicable only for normal distribution
- It is a better indicator of the variance than the range
Q. When a relationship between the heart rate and Valsalva ratio is studied, the mean is useful, but the dispersion of the data is also very useful. Which method of spread will be more useful in this?
- Range
- Standard deviation
- Coefficient of variance
- Percentage
- Interquartile range
Explanation
There are 2 data sets, i.e., heart rate and valsalva, that are compared so whenever spread of 2
data is compared, COV is used.
Also read: Hyponatremia: Classification, Signs & Symptoms
Q. If the birth weight of each of 10 babies born in a hospital in a day is found to be 2.8 kgs, then the standard deviation of this sample will be
- 2.8
- 0
- 1
- 28
Q. A study had a normal distribution with a median value of 200 and a standard deviation of 20. 68% will fall between:
- 160-240
- 170-230
- 180-220
- 190-210
Q. In a group of 100 children, the mean weight of children is 15 kg. The standard deviation is 1.5 kg. Which one of the following is true?
- 95% of all children weigh between 12 and 18 kg
- 95% of all children weigh between 13.5 and 16.5 kg
- 99% of all children weigh between 12 and 18 kg
- 99% of all ren weigh between 13.5 and 16.5 kg
Q. A Type 1 statistical error is said to have occurred if:
- The null hypothesis is true and is accepted
- The null hypothesis is false but is accepted
- The null hypothesis is true but is rejected
- The null hypothesis is false and is rejected
Q. A randomized trial comparing the efficacy of two drugs showed a difference between the two (p <0.05). Assume that in reality, however, the two drugs do not differ. This is, therefore, an example
- Type I error
- Type II error
- 1- alpha
- D. 1- beta
Q. When the standard for accepting the difference was at a p-value of 0.05 and the calculated value was at 0.01, the null hypothesis was rejected by the researcher. What do you think of the results?
- Wrongly rejected
- Significant difference
- No difference
- The alternate hypothesis is the wrong
- The sample size was small
Also read: NEET PG Previous Year Question Papers of Last 6 Years
Q. In 95% confidence interval, the level of significance (α)
- 0.01
- 0.05
- 0.1
- None of these
Q. p-value is defined as
- Probability of declaring a significant difference when actually it is not present
- Probability of declaring a significant difference when actually it is present
- Probability of not declaring a significant difference when actually it is not current
- Probability of not declaring a significant difference when actually it is present
p-value is:
- Probability of committing a Type 1 error
- Type 1 error: Null hypothesis is true but rejected
Q. The p-value of a randomized controlled trial comparing operation X, which is a new procedure, and operation Y, which is a gold standard procedure, is 0.04. The conclusion from the following is:
- The investigator can be 96% sure that the result is obtained by chance
- The probability of a false positive conclusion that operation X is better than operation Y when the truth is it is not is 4%
- Type II error is small, and we can accept the findings of this study
- The power of the study to detect a difference between operations X and Y is 96%.
Q. Which of the following results gives the reader the most information concerning the statistical significance, sample size, and strength of association?
- A relative risk of 2.5 with a 95% CI of 2.0 to 3.1
- A p-value of 0.4 and a relative risk of 0.6
- A relative risk of 5.0 with a 95 % CI of 0.1 to 9.8
- A p-value of <0.5 and a relative risk of 2.5.
Q. All of the following are non-parametric tests except?
- Chi-square test
- Z test
- Wilcoxon rank sum test
- Kruskal Wallis H test
Q. A study to compare the hemoglobin level was conducted on alcoholics before and after consumption. The statistical method used to find significance Is?
- Chi-square test
- Unpaired T test
- Paired T-test
- Mann Whitney test
Q. The test used to compare two qualitative data is?
- Paired T-test
- Unpaired T test
- Chi-square test
- Anova
Also read: NEET PG High Yield Questions for Physiology
Q. All of the following can be analyzed using the chi-square test except?
- Sex and stage of cancer
- Heart rate/min and age
- Benign or malignant, and Type of surgery
- Age group and cancer stage
Q. The appropriate statistical test to find out if obesity is a significant risk factor for breast cancer is?
- Student's paired T-test
- Student's unpaired T-test
- Chi-square test
- Wilcoxon signed-rank test
Q. Three groups of subjects were followed over the course of five years to compare treatments for sideroblastic anemia. The most appropriate statistical analysis to determine the quantitative serologic differences resulting from these treatments would be
- Regression analysis
- ANOVA
- Correlation analysis
- Chi-square test
- T-test
Q. The weight of the group of 50 boys aged 12 years was 35+5 kg, & 40 girls the same age were 32+3 kg. Test applicable to test statistical significance difference in weight
- Chi-square test
- Z test
- T
- ANOVA
|
|
Q. A popular method of presenting data to the man in the street and those who cannot understand orthodox charts is?
- Histogram
- Frequency polygon
- Line Diagram
- Pictogram
Q. What frequency of quantitative data is represented by?
- Histogram
- Scatter diagram
- Line diagram
- Frequency curve
Q. Best way to plot the change of incidence of disease over time is called
- Histogram
- Line chart
- Scatter diagram
- Ogive
Q. Best chart to represent Incidence of disease over a period of time?
- Histogram
- Bar chart
- Scatter plot
- Line diagram
Q. Graph to correlate two quantitative data is
- Histogram
- Scatter diagram
- Line diagram
- Frequency curve
Also read: Hypernatremia: Causes, Pathophysiology
Q. Which of the following related to the image is correct?
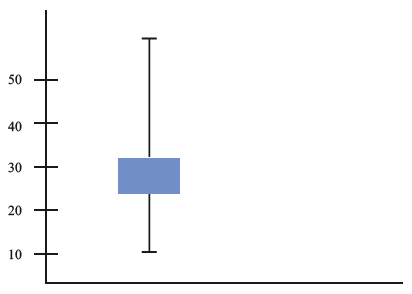
- Negatively skewed
- Positively skewed
- 75% values are above 25 mg
- Median is 50 mg
Explanation
- Rotate in clockwise direction
- Q2 is lying in around 25 mg. Median
- Q2 = 1:1 ratio; so, 50% values above median, not 75%
Q. Identify the correct sequence of inference from box plots shown in the figure
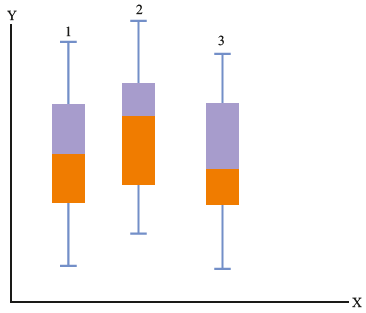
- 1-Normal distribution, 2-positive skewed, 3-negative skewed
- 1-Normal distribution, 2-negative skewed, 3-positive skewed
- 1-Negative skewed, 2-positive skewed, 3-normal distribution
- 1: Positive skewed, 2: normal distribution. 3-negative skewed
Q. The data description shown below is referred to as?
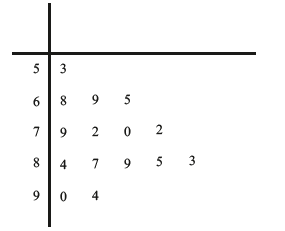
- Stem and leaf diagram
- Box whisker plot
- Forest plot
- Funnel plot
Q. In the WHO-recommended EPI cluster sampling for assessing primary immunization coverage, the age group of children to be surveyed is
- 0- 12 months
- 6-12 months
- 9-12 months
- 12-23 months
Q. Is simple random sampling ideal for?
- Vaccinated people
- Heterogeneous population
- Homogeneous population
- All of the above
Download the PrepLadder App and get the best neet pg online coaching with world-class video lectures, QBank, Mock Tests and more!

PrepLadder Medical
Get access to all the essential resources required to ace your medical exam Preparation. Stay updated with the latest news and developments in the medical exam, improve your Medical Exam preparation, and turn your dreams into a reality!
Navigate Quickly
Let's start with the question and answer series:
MCQ's
Explanation:
Top searching words
The most popular search terms used by aspirants
- NEET PG Physiology
- NEET PG Preparation