Economic Survey 2023 | Top 20 Key Highlights
Feb 1, 2023

Enhance your UPSC CSE preparation with our daily dose of Current Affairs wherein we discuss topics that make news at National and International level. In today's edition of our Current Affairs, we will discuss Economic Survey 2023 | Top 20 Key Highlights. The topic's relevance to the UPSC CSE syllabus is mentioned below.
For Prelims: Economic and Social Development
Economic Survey, Chief Economic Advisor (CEA), Gross Domestic Product (GDP), Scheduled Commercial Banks (SCBs)
For Mains: GS Paper III (Government Budgeting)
About Economic Survey, History of Economic Survey, Key highlights of the Economic Survey 2022-23, Significance of the Economic Survey
Context
Every year the Chief Economic Adviser (CEA) releases the Economic Survey for the current financial year (2022-23) a day before Union Budget is presented i.e. roughly around January 31, as Union Budgets are scheduled for February 1, 2023.
Probable Question
Indian economy staging a broad-based recovery across sectors, is positioning to ascend to the pre-pandemic growth path in FY23. Comment ( 150 words, 10 marks)
About Economic Survey
- It is a detailed report of the state of the national economy in the financial year that is coming to a close.
- Preparation: It is prepared by the Economic Division of the Department of Economic Affairs (DEA) under the guidance of the Chief Economic Advisor (CEA).
- Approval: Once prepared, the Survey is approved by the Finance Minister.
History of Economic Survey
- The first Economic Survey was presented for 1950-51 and until 1964, it was presented along with the Budget.
- Similarly, for the longest time, the survey was presented in just one volume, with specific chapters dedicated to different key sectors of the economy (services, agriculture, and manufacturing) and key policy areas (fiscal developments, state of employment, inflation, etc.) This volume carries a detailed statistical abstract as well.
- From 2010-11 to 2020-21, the survey was presented in two volumes. The additional volume carried the intellectual imprint of the Chief Economic Advisor (CEA) and often dealt with some of the major issues and debates facing the economy.
- In 2021-22, the survey was again reverted back to a single-volume format, possibly because it was prepared and presented while there was a change in guard in the CEA’s office.
Significance of the Economic Survey
- Non-binding: The assessments and recommendations in the Economic Survey are not binding on the budget.
- It is the most authoritative and comprehensive analysis of the economy that is conducted from within the Union government.
- Its observations and details provide an official framework for analyzing the Indian economy.
Key highlights of the Economic Survey 2022-23
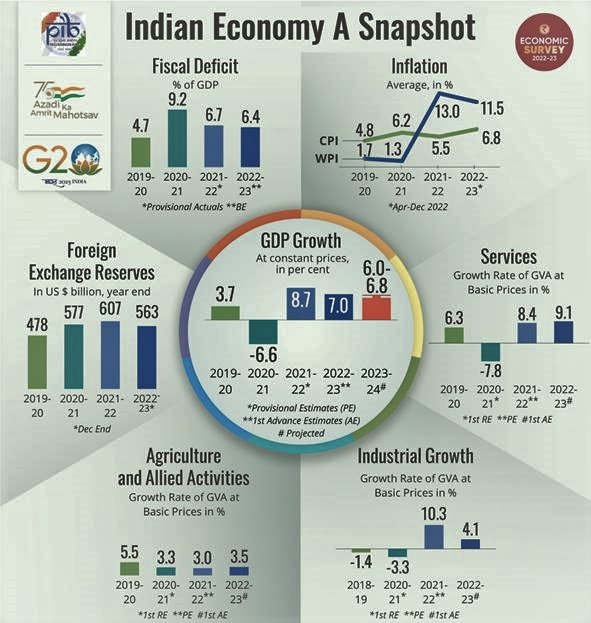
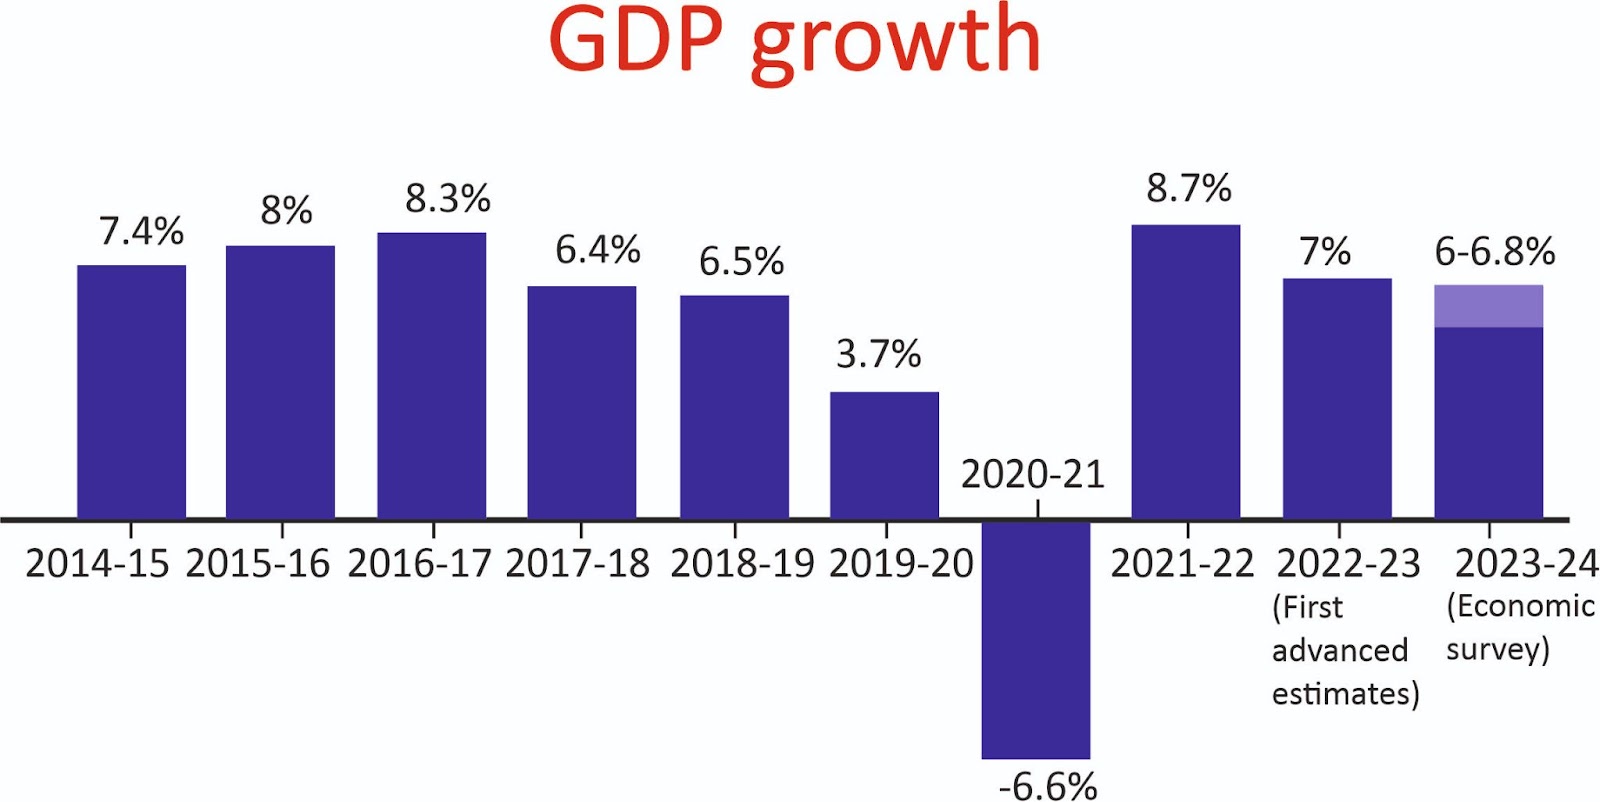
State of the Economy 2022-23
- India's Gross Domestic Product (GDP) growth is expected to remain robust in FY24. GDP forecast for FY24 to be in the range of 6-6.8 %.
- The higher private consumption in H1 is the highest since FY15 and has boosted production activity resulting in enhanced capacity utilization across sectors.
- The credit growth to the MSME sector was over 30.6% on average during Jan-Nov 2022.
- Retail inflation is back within RBI's target range in November 2022.
- Indian Rupee performed well compared to other Emerging Market Economies in Apr-Dec2022.
- Direct Tax collections for the period April-November 2022 remain buoyant.
- Enhanced Employment generation saw in the declining urban unemployment rate and in the faster net registration in the Employee Provident Fund (EPF).
- Economic growth is to be boosted by the expansion of public digital platforms and measures to boost manufacturing output.
India’s Medium-Term Growth Outlook
- During 2014-2022 Indian economy’s fundamentals strengthened due to overall enhanced efficiency.
- A fresh credit cycle has already begun with improved and healthier balance sheets of the banking, non-banking and corporate sectors.
- The Indian economy has also started benefiting from the efficiency gains resulting from greater formalization, higher financial inclusion, and economic opportunities created by digital technology-based economic reforms.
- However, global shocks and a boom in credits adversely impacted the key macroeconomic variables such as credit growth, capital formation, and hence economic growth during 2014-22.
- The Indian economy is well placed to grow faster in the coming decade once the global shocks of the pandemic and the spike in commodity prices in 2022 fade away.
Fiscal Developments
- The Gross Tax Revenue registered a YoY growth of 15.5% from April to November 2022, driven by robust growth in the direct taxes (higher in the first 8 months) and Goods and Services Tax (GST).
- The gross GST collections increased at 24.8% on a year-over-year growth analysis (YoY) basis from April to December 2022, a vital revenue source for central and state governments.
- The Centre's capital expenditure (Capex) has steadily increased from a long-term average of 1.7% of GDP (FY09 to FY20) to 2.5% of GDP in FY22 PA. This has large-scale positive implications for medium-term growth.
Monetary Management and Financial Intermediation
- The RBI initiated its monetary tightening cycle in April 2022 and has since raised the repo rate by 225 bps, leading to moderation of surplus liquidity conditions.
- Cleaner balance sheets led to enhanced lending by financial institutions. Credit disbursed by Non-Banking Financial Companies (NBFCs) has also been on the rise.
- The recovery rate for the Scheduled Commercial Banks (SCBs) through Insolvency and Bankruptcy (IBC) was highest in FY22 compared to other channels.
- The growth in credit offtake is expected to sustain, and combined with a pick-up in private capex, will usher in a virtuous investment cycle.
- Non-food credit offtake by scheduled Commercial Banks (SCBs) has been growing in double digits since April 2022.
- The Gross Non-Performing Assets (GNPA) ratio of SCBs has fallen to a seven-year low of 5.0.
- The Capital-to-Risk Weighted Assets Ratio (CRAR) remains healthy at 16.0.
Prices and Inflation
- India’s retail inflation rate peaked at 7.8% in April 2022, above the RBI’s upper tolerance limit of 6%. However, this overshoot of inflation in India was one of the lowest in the world.
- The government adopted a multi-pronged approach (reduction in the export duty of petrol and diesel, zero import duty on major inputs, increased tax on export of iron ores by 50%, waived custom duty on cotton from April to September 2022, and reduction in basic duty on oils) to tame the increase in price levels.
- The RBI’s anchoring of inflationary expectations through forward guidance and responsive monetary policy has helped guide the trajectory of inflation in the country.
- Timely policy intervention by the government in the housing sector, coupled with low home loan interest rates propped up demand and attracted buyers more readily in the affordable segment in FY23.
- An overall increase in composite Housing Price Indices (HPI) assessment and Housing Price Indices market prices indicate a revival in the housing finance sector.
Also Read: What are Green Debt Swaps and How Do They Work?
Social Infrastructure and Employment
- Central and State Government’s budgeted expenditure on the health sector touched 2.1% of GDP in FY23 (BE) and 2.2% in FY22 (RE) against 1.6% in FY21.
- Social sector expenditure increased to Rs. 21.3 lakh crore in FY23 (BE) from Rs. 9.1 lakh crore in FY16.
- 41.5 crore people exited poverty in India between 2005-06 and 2019-20 as per the findings of the 2022 report of the UNDP on Multidimensional Poverty Index which says that.
- The Aspirational Districts Programme has emerged as a template for good governance, especially in remote and difficult areas.
- eShram portal, for creating a National database of unorganized workers, received registration of over 28.5 crore unorganized workers.
- JAM (Jan-Dhan, Aadhaar, and Mobile) trinity, combined with the power of DBT, has brought the marginalized sections of society into the formal financial system, revolutionizing the path of transparent and accountable governance by empowering the people.
- Aadhaar played a vital role in developing the Co-WIN platform and in the transparent administration of over 2 billion vaccine doses.
- Labor markets have recovered beyond pre-Covid levels, in both urban and rural areas, with unemployment rates falling from 5.8% in 2018-19 to 4.2% in 2020-21.
- The year FY22 saw improvement in Gross Enrolment Ratios (GER) in schools and improvement in gender parity.
- Total health expenditure declined from 64.2% in FY14 to 48.2% in FY19.
- Infant Mortality Rate (IMR), Under Five mortality rate (U5MR), and neonatal Mortality Rate (NMR) have shown a steady decline.
- More than 220 crore COVID vaccine doses were administered as on 06 January 2023.
- Nearly 22 crore beneficiaries have been verified and over 1.54 lakh Health and Wellness Centres have been operationalized under the Ayushman Bharat Scheme as on 04 January 2023.
Climate Change and Environment
- India declared the Net Zero Pledge to achieve a net zero emissions goal by 2070, to reduce the emissions intensity of its GDP by 45% by 2030 from 2005 levels, and about 50% of cumulative electric power installed capacity to come from non-fossil fuel-based energy resources by 2030.
- India achieved its target of 40% installed electric capacity from non-fossil fuels ahead of 2030.
- The likely installed capacity from non-fossil fuels is to be more than 500 GW by 2030 resulting in a decline of the average emission rate by around 29% by 2029-30, compared to 2014-15.
- A mass movement LIFE (Lifestyle for Environment) was launched and Sovereign Green Bond Framework (SGrBs) was issued.
- National Green Hydrogen Mission was to enable India to be energy independent by 2047 and creation of over 6 lakh jobs by 2030.
- Green hydrogen production capacity of at least 5 MMT (Million Metric Tonne) per annum to be developed by 2030.
- Renewable energy capacity addition of about 125 GW and abatement of nearly 50 MMT of annual GHG emissions by 2030.
- Solar power capacity installed, a key metric under the National Solar Mission stood at 61.6 GW as of October 2022.
- 62.8 lakh individual household toilets and 6.2 lakh community and public toilets were constructed (August 2022) under the National Mission on Sustainable Habitat.
Agriculture and Food Management
- Private investment in agriculture increases to 9.3% in 2020-21.
- The minimum Support Price (MSP) for all mandated crops fixed at 1.5 times all India's weighted average cost of production since 2018.
- Institutional Credit to the Agricultural Sector continued to grow to 18.6 lakh crore in 2021-22
- Foodgrains production in India saw a sustained increase and stood at 315.7 million tonnes in 2021-22.
- Free foodgrains to about 81.4 crore beneficiaries under the National Food Security Act for one year from January 1, 2023. About 11.3 crore farmers were covered under the Scheme in its April-July 2022-23 payment cycle.
- Rs 13,681 crores were sanctioned for Post-Harvest Support and Community Farms under the Agriculture Infrastructure Fund.
- Online, Competitive, Transparent Bidding System with 1.74 crore farmers and 2.39 lakh traders put in place under the National Agriculture Market (e-NAM) Scheme.
- Organic Farming is being promoted through Farmer Producer Organisations (FPO) under the Paramparagat Krishi Vikas Yojana (PKVY).
- India stands at the forefront to promote millet through the International Year of Millet initiative.
Industry
- Overall Gross Value Added (GVA) by the Industrial Sector in the first half of FY 22-23 rose by 3.7%, which is higher than the average growth of 2.8% achieved in the first half of the last decade.
- Robust growth in Private Final Consumption Expenditure, export stimulus during the first half of the year, increase in investment demand triggered by enhanced public capex and strengthened bank and corporate balance sheets have provided a demand stimulus to industrial growth.
- The supply response of the industry to the demand stimulus has been robust.
- Growth of 30% in credit to Micro, Small, and Medium Enterprises (MSMEs) and double-digit growth in credit to large industries have been showing since October 2022.
- Electronics exports rise nearly threefold, from US $4.4 billion in FY19 to US $11.6 Billion in FY22.
- India has become the second-largest mobile phone manufacturer globally, with the production of handsets going up from 6 crore units in FY15 to 29 crore units in FY21.
- Foreign Direct Investment (FDI) flows into the Pharma Industry have risen four times, from US $180 million in FY19 to US $699 million in FY22.
- The Production Linked Incentive (PLI) schemes introduced across 14 categories have seen an investment of ₹47,500 crores in FY22, which is 106% of the designated target for the year.
- Production/sales worth ₹3.85 lakh crore and employment generation of 3.0 lakh have been recorded due to PLI schemes.
- Over 39,000 compliances have been reduced and more than 3500 provisions decriminalized as of January 2023.
Services
- The services sector is expected to grow at 9.1% in FY23, as against 8.4% (YoY) in FY22.
- India was among the top ten services exporting countries in 2021, with its share in world commercial services exports increasing from 3% in 2015 to 4% in 2021.
- The credit to services sector has grown by over 16% since July 2022.
- US$ 7.1 billion FDI equity inflows in the services sector in FY22.
- Contact-intensive services are set to reclaim pre-pandemic level growth rates in FY23.
- Sustained growth in the real estate sector is taking housing sales to pre-pandemic levels, with a 50% rise between 2021 and 2022.
- The tourism sector is showing signs of revival, with foreign tourist arrivals in India in FY23 growing month-on-month with the resumption of scheduled international flights and easing of Covid-19 regulations. The hotel occupancy rate has improved to 68-70% in November 2022.
- Digital platforms are transforming India’s financial services.
- India’s e-commerce market is projected to grow at 18% annually through 2025.
External Sector
- Merchandise exports were US$ 332.8 billion for April-December 2022.
- India diversified its markets and increased its exports to Brazil, South Africa, and Saudi Arabia.
- To increase its market size and ensure better penetration, in 2022, Comprehensive Economic Partnership Agreement (CEPA) with UAE and Economic Cooperation and Trade Agreement (ECTA) with Australia come into force.
- Remittances are the second largest major source of external financing after service export and India is the largest recipient of remittances in the world receiving US$ 100 bn in 2022.
- As of December 2022, Forex Reserves stood at US$ 563 bn covering 9.3 months of imports. India is the sixth largest foreign exchange reserve holder in the world.
- India has relatively low levels of total debt as a percentage of Gross National Income and short-term debt as a percentage of total debt.
Also Read: Government Budget and the Economy
Physical and Digital Infrastructure
Public Private Partnerships
- In-Principal Approval was granted to 56 projects with a Total Project Cost of ₹57,870.1 crore under the VGF Scheme, from 2014-15 to 2022-23.
- India Infrastructure Project Development Fund Scheme (IIPDF Scheme) with ₹150 crore outlay from FY 23-25 was notified by the government on 03 November, 2022.
National Infrastructure Pipeline
- NIP and Project Monitoring Group (PMG) portal linkage to fast-track approvals/ clearances for projects.
- 89,151 projects costing ₹141.4 lakh crore under different stages of implementation, 1009 projects worth ₹5.5 lakh crore completed
National Monetisation Pipeline (NMP)
- ₹ 0.9 lakh crore monetization target achieved against expected ₹0.8 lakh crore in FY22.
- FY23 target is envisaged to be ₹1.6 lakh crore (27% of the overall NMP Target).
GatiShakti
- GatiShakti aims to improve multimodal connectivity and logistics efficiency while addressing the critical gaps for the seamless movement of people and goods.
- PM GatiShakti National Master Plan creates a comprehensive database for integrated planning and synchronized implementation across Ministries/ Departments.
Electricity Sector and Renewables
- As on 30 September 2022, the government has sanctioned the entire target capacity of 40 GW for the development of 59 Solar Parks in 16 states.
- 17.2 lakh GWh of electricity was generated during the year FY22 compared to 15.9 lakh GWh during FY21.
- The total installed power capacity (industries having a demand of 1 Mega Watt (MW) and above) increased from 460.7 GW on 31 March 2021 to 482.2 GW on 31 March 2022.
Making Indian Logistics Globally Competitive
- The rapid increase in National Highways (NHs) /Roads Construction with 10457 km NHs/roads constructed in FY22 compared to 6061 km in FY16.
- Budget expenditure increased from ₹1.4 lakh crore in FY20 to ₹2.4 lakh crore in FY23 giving a renewed push to Capital expenditure.
- 2359 Kisan rails transported approximately 7.91 lakh tonnes of perishables, as of October 2022.
- More than one crore air passengers availed the benefit of the (Ude Desh Ka Aam Naagrik) UDAN scheme since its inception in 2016. Near doubling of capacity of major ports in 8 years.
- Inland Vessels Act 2021 replaced the 100-year-old Act to ensure hassle-free movement of Vessels promoting Inland Water Transport.
India’s Digital Public Infrastructure
Unified Payment Interface (UPI) based transactions grew in value (121%) and volume (115%) terms, between 2019-22, paving the way for its international adoption.
Telephone and Radio - For Digital Empowerment
- The total telephone subscriber base in India stands at 117.8 crores (as of Sept,22), with 44.3% of subscribers in rural India. The overall teledensity in India stood at 84.8% on March 22.
- 200% increase in rural internet subscriptions between 2015 and 2021.
- Prasar Bharati (India’s autonomous public service broadcaster) - broadcasts in 23 languages, and 179 dialects from 479 stations. Reaches 92% of the area and 99.1% of the total population.
Digital Public Goods
- Achieved low-cost accessibility since the launch of Aadhaar in 2009.
- Under the government schemes, MyScheme, TrEDS, GEM, e-NAM, and UMANG have transformed the marketplace and have enabled citizens to access services across sectors
- Under Account Aggregator, the consent-based data-sharing framework is currently live across over 110 crore bank accounts.
- The National AI portal has published 1520 articles, 262 videos, and 120 government initiatives and is being viewed as a tool for overcoming the language barrier e.g. ‘Bhashini’.
- Legislations are being introduced for enhanced user privacy and to create an ecosystem for standard, open, and interoperable protocols underlining robust data governance.
Significance of the Economic Survey 2022-23
- The survey is conducted immediately after the Covid-19 pandemic thus it is significant in diagnosing the true extent of economic recovery in the Indian economy and whether India’s growth potential has lost a step or not.
- In the current year, the economy has also witnessed historically high unemployment and a sharp rise in poverty and inequality thus the survey can play a significant role to paint future scenarios and also suggest policy solutions.
- The year 2023 was full of turmoils at the global level as well due to the Ukraine war, recession, etc which has also impacted the economy thus the survey would be crucial for providing the likely solutions.
Frequently Asked Questions
What is the Economic Survey 2022-23?
It is a detailed report of the state of the national economy in the financial year that is coming to a close (2022-23).
Who presented the Union Budget 2023-24?
The Union Budget for the financial year 2023-24 will be presented by Finance Minister Nirmala Sitharaman on 1st February 2023.
What is the latest Economic Survey of India?
State of the Economy 2022-23
- India's Gross Domestic Product (GDP) growth is expected to remain robust in FY24. GDP forecast for FY24 to be in the range of 6-6.8 %.
- The higher private consumption in H1 is the highest since FY15 and has boosted production activity resulting in enhanced capacity utilization across sectors.
- The credit growth to the MSME sector was over 30.6% on average during Jan-Nov 2022.
- Retail inflation is back within RBI's target range in November 2022.
- Indian Rupee performed well compared to other Emerging Market Economies in Apr-Dec2022.
- Direct Tax collections for the period April-November 2022 remain buoyant.
- Enhanced Employment generation saw in the declining urban unemployment rate and in the faster net registration in the Employee Provident Fund (EPF).
- Economic growth is to be boosted by the expansion of public digital platforms and measures to boost manufacturing output.
News Source: The Indian Express
If you want to enhance your IAS preparation and crack the UPSC CSE examination, download the PrepLadder app and get access to the finest study material for UPSC curated by India’s top UPSC faculty.
You can also join our Telegram channel for UPSC coaching and to stay updated with the latest information about the UPSC exam.

PrepLadder IAS
Get quick access to the latest happenings across the globe. Articles revolving around factual data that aims to boost your UPSC CSE preparation and make your dreams become a reality!
Navigate Quickly
Context
Probable Question
About Economic Survey
History of Economic Survey
Significance of the Economic Survey
Key highlights of the Economic Survey 2022-23
State of the Economy 2022-23
India’s Medium-Term Growth Outlook
Fiscal Developments
Monetary Management and Financial Intermediation
Prices and Inflation
Social Infrastructure and Employment
Climate Change and Environment
Agriculture and Food Management
Industry
Services
External Sector
Physical and Digital Infrastructure
Public Private Partnerships
National Infrastructure Pipeline
National Monetisation Pipeline (NMP)
GatiShakti
Electricity Sector and Renewables
Making Indian Logistics Globally Competitive
India’s Digital Public Infrastructure
Telephone and Radio - For Digital Empowerment
Digital Public Goods
Significance of the Economic Survey 2022-23